Nearly two years into the COVID-19 pandemic, the coronavirus is continuing to reshape consumer behavior and spending in lasting ways. Within weeks of COVID-19 shutdowns in the spring of 2020, the economy saw major shifts in sectors like retail and hospitality as consumers shifted more of their spending to the home and online, and it appears that some of these shifts will be permanent.
One of the categories that has been reckoning with these shifts is entertainment. The Bureau of Labor Statistics (BLS) definition of the arts, entertainment, and recreation sector includes establishments that are involved in live performances and events (like theaters and concert venues), those that exhibit objects of educational interest (like art museums and historical sites), and those that provide other forms of recreation or amusement (like theme parks). These sorts of businesses were exactly the type of establishments that consumers spent less on in 2020 and 2021 due to the pandemic.
Most of the businesses in this sector rely heavily on patrons paying for admission or other fees associated with the use of a space. But under public health restrictions implemented in response to COVID-19, many businesses were forced to temporarily close or else operate at reduced capacity. As the pandemic continued into 2020 and 2021, ongoing concerns about the spread of the coronavirus kept attendance down, even as state and local governments relaxed capacity restrictions over time. Consequently, overall revenues in the sector dropped from $61 billion in the last quarter of 2019 to $23 billion in the second quarter of 2020. One year later, in the second quarter of 2021, revenues had only recovered to around $49.5 billion.
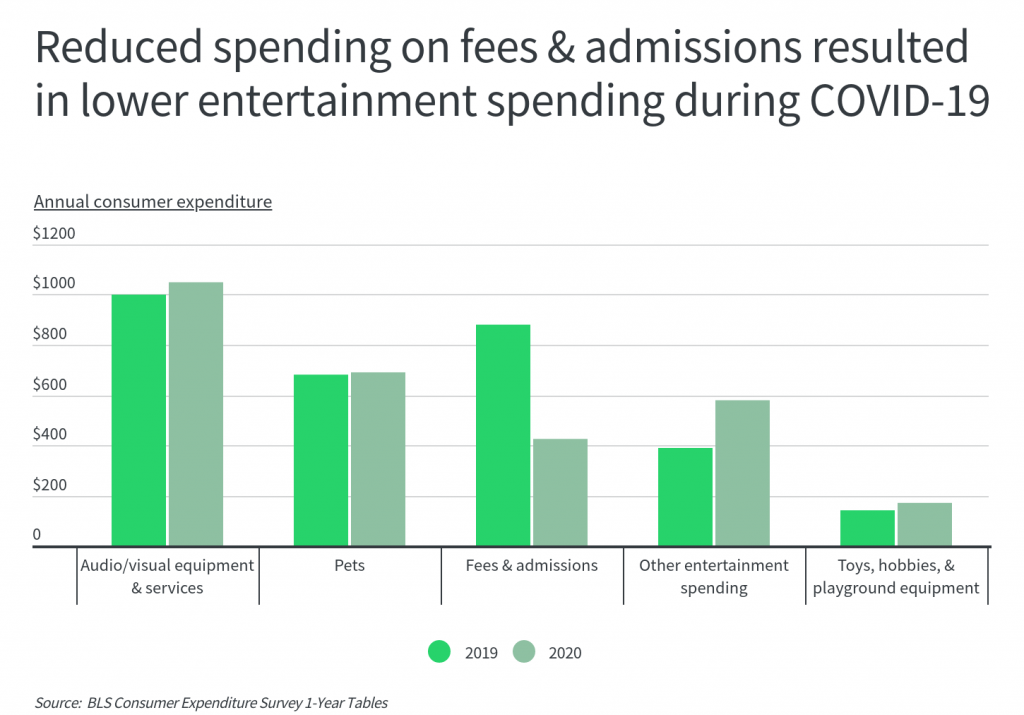
This sector-wide decline is also apparent in data on household expenditures. From 2019 to 2020, consumer expenditures on entertainment—defined slightly differently than above in the BLS Consumer Expenditure Survey—dropped by around 5.7%, driven by a 51.7% reduction in spending on fees and admissions. While other categories like audiovisual equipment, pets, and toys, and hobbies saw flat or slightly increased spending from 2019 to 2020, typical annual household spending on fees and admissions dropped from $880 to $425.
DID YOU KNOW?
There are dozens of website builders out there, each with unique features that could prove useful when creating your new website. We reviewed the best and ranked them in our best website builders 2021 guide.
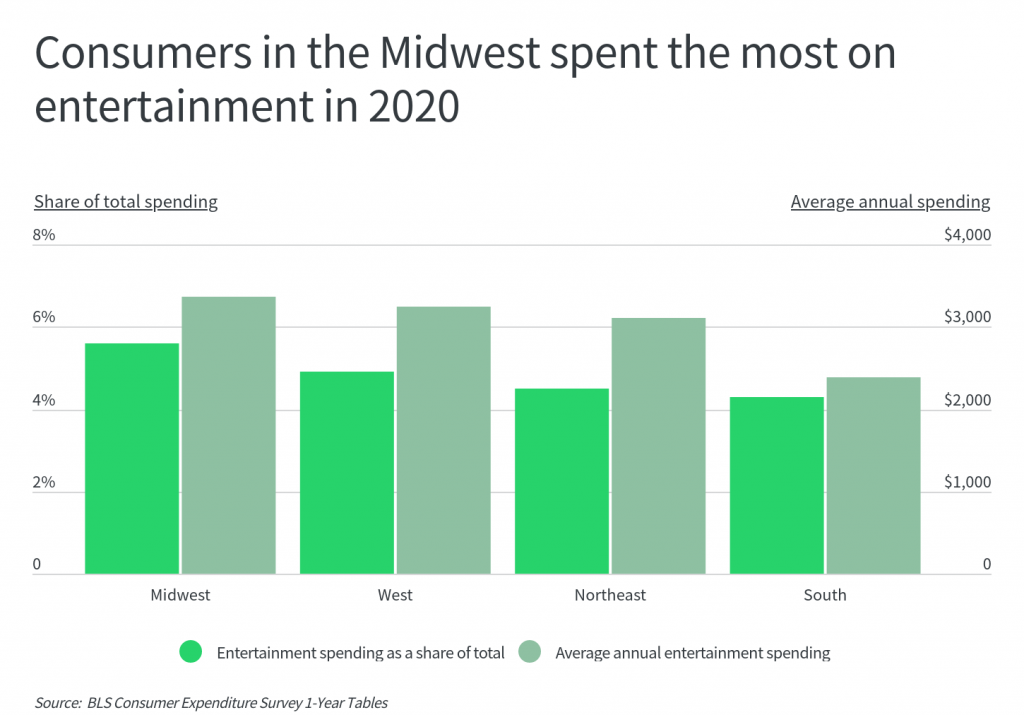
However, different regions of the U.S. show slightly different behavior when it comes to entertainment spending. The Midwest leads the country in average annual entertainment spending, at $3,368, and in spending on entertainment as a percentage of overall household spending, at 5.6%. Interestingly, this phenomenon does not appear to be strongly connected with income levels: the South and Midwest have similar average pre-tax incomes around $78,000, but Midwesterners spend nearly $1,000 more per year on entertainment than their Southern counterparts.
At the local level, the top entertainment spenders are spread across the country and, like the regions, include both higher-earning and lower-earning areas. For example, a household in Minneapolis and a household in San Francisco spend approximately the same total amount on entertainment, even though the typical income in San Francisco is more than $40,000 higher.
The data used in this study is from the BLS Consumer Expenditure Survey. To identify the major U.S. metros spending the most on entertainment, researchers at Namechk.com calculated total entertainment spending as a proportion of total spending for each location. In the event of a tie, the location with the greater total entertainment spending was ranked higher. Only the largest metropolitan statistical areas with available data from BLS were included in the analysis.
Here are the major U.S. metros spending the most on entertainment.
Major Metros Spending the Most on Entertainment

10. Dallas-Fort Worth, TX
- Entertainment spending as a share of total: 4.4%
- Average annual entertainment spending: $2,742
- Average annual total spending: $62,306
- Average annual pre-tax income: $91,338
TRENDING
Turning a business idea into a reality is exciting, but there’s a lot more work than you might think—choosing a name and registered agent, and all the proper paperwork to name a few. Start with our guide on how to start a business, and get your business dreams moving today.

9. San Francisco, CA
- Entertainment spending as a share of total: 4.4%
- Average annual entertainment spending: $4,063
- Average annual total spending: $91,728
- Average annual pre-tax income: $156,851

8. Minneapolis-St. Paul, MN
- Entertainment spending as a share of total: 5.0%
- Average annual entertainment spending: $4,020
- Average annual total spending: $80,046
- Average annual pre-tax income: $116,495

7. Detroit, MI
- Entertainment spending as a share of total: 5.2%
- Average annual entertainment spending: $3,278
- Average annual total spending: $63,008
- Average annual pre-tax income: $89,991

6. St. Louis, MO
- Entertainment spending as a share of total: 5.3%
- Average annual entertainment spending: $3,410
- Average annual total spending: $64,389
- Average annual pre-tax income: $84,232

5. San Diego, CA
- Entertainment spending as a share of total: 5.5%
- Average annual entertainment spending: $4,579
- Average annual total spending: $83,216
- Average annual pre-tax income: $110,132

4. Denver, CO
- Entertainment spending as a share of total: 6.2%
- Average annual entertainment spending: $4,675
- Average annual total spending: $75,760
- Average annual pre-tax income: $112,907

3. Seattle, WA
- Entertainment spending as a share of total: 6.4%
- Average annual entertainment spending: $5,235
- Average annual total spending: $81,728
- Average annual pre-tax income: $115,548
RELATED
Putting the time into choosing a good business name can pay dividends over the lifecycle of a business. Try our business name generator to get started on your business dreams today.

2. Anchorage, AK
- Entertainment spending as a share of total: 6.7%
- Average annual entertainment spending: $4,936
- Average annual total spending: $73,189
- Average annual pre-tax income: $91,537

1. Houston, TX
- Entertainment spending as a share of total: 8.6%
- Average annual entertainment spending: $6,040
- Average annual total spending: $69,872
- Average annual pre-tax income: $91,255
Methodology & Detailed Findings
The data used in this study is from the U.S. Bureau of Labor Statistics Consumer Expenditure Survey. National and regional figures are from the 2020 one-year survey; whereas, statistics for metropolitan statistical areas are from the 2019–2020 two-year survey (the most recent available). To identify the major U.S. metros spending the most on entertainment, researchers calculated total entertainment spending as a proportion of total spending for each location. In the event of a tie, the location with the greater total entertainment spending was ranked higher.
The BLS entertainment category includes five main subcategories: audio and visual equipment and services; pets; fees and admissions; toys, hobbies, and playground equipment; and other entertainment spending. Detailed descriptions of these subcategories can be found at the Consumer Expenditure Survey glossary page. Only the 22 largest metropolitan statistical areas with available data from BLS were included in the analysis.